Data and smoking numbers
Prevalence
The National Policy on Tobacco Control in Brazil contributed to a significant decline in adult smoker’s percentage. In 1989, 34.8 % of the population above 18 years used to smoke. A significant decline was observed in 2003, when the percentage was 22.4 %2. In 2008 this percentage was 18.5%. The latest data, to 2013, indicate the percentage of 14.7% adult smokers. Considering the period 1998-2010 the percentage of smokers in Brazil decrease 46% and 420,000 deaths were avoided.(IBGE2 2009; IBGE 2014; INAN, 2015).
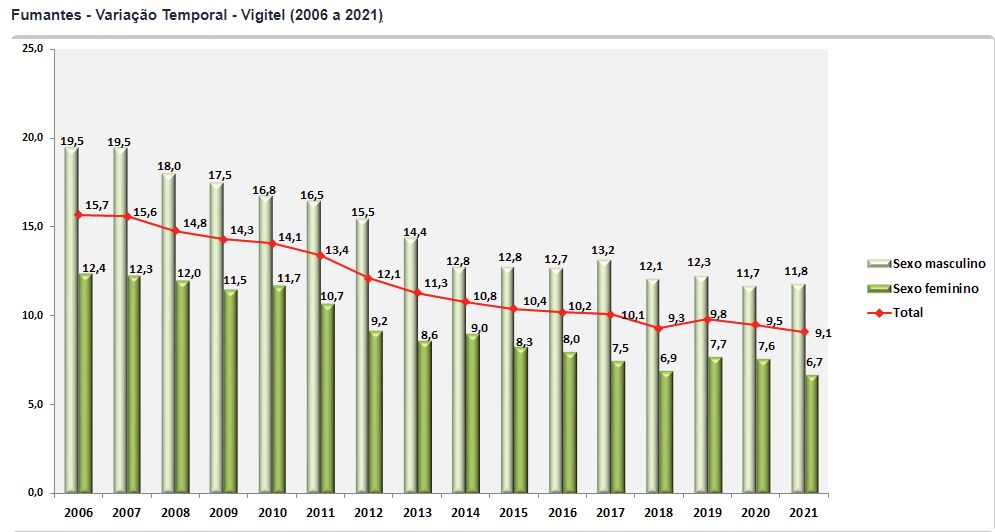
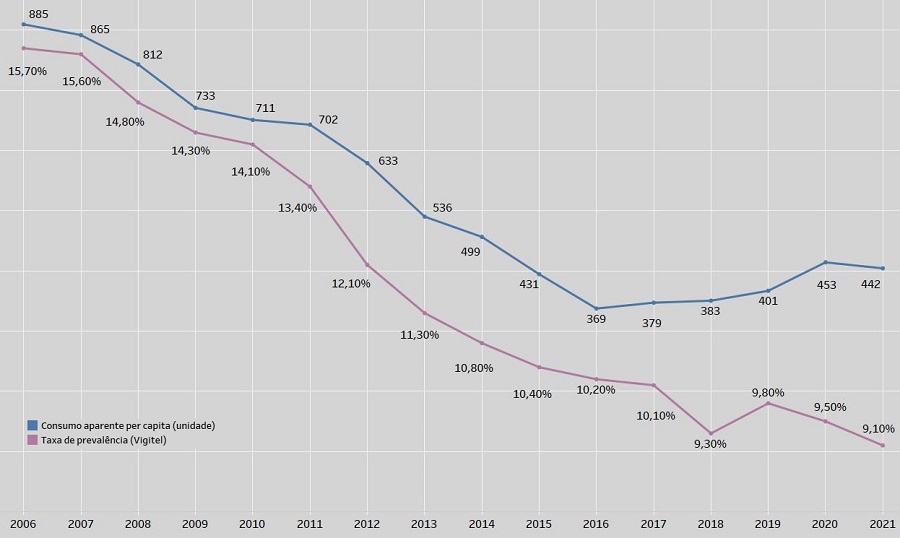
In addition to household surveys presented above, the percentage of smokers in Brazil is also estimated since 2006 through annual monitoring by phone - Annual Surveys on Risk and Protective Factors for Chronic Diseases (VIGITEL). This survey is conducted in 26 Brazilian capitals and the Federal District with adults 18 years or more by telephone line. According to data from 2021 Vigital, the smokers percentage aged 18 or more in Brazil is 9,1%, represented by 11,8% of men and 6,7% of women.
According to 2012 National Survey on Student Health (PeNSE), 19.6% of students had experimented cigarettes. The highest frequency of experimentation was in the Southern region (28.6%) and lowest in the Northeast (14.9%). There was no significant difference in gender distribution. It was higher among students in public schools (20.8%), than private schools (13.8%). It also showed that a number of students who have experienced smoking at least once in life decreased from 24.2% in 2009 to 22.3% in 2012. The data include not only the Capital, but other municipalities too (IBGE, 2009; IBGE, 2015).
Graph 1 - Vigitel Brasil 2006 a 2021: Vigilância de Fatores de Risco e Proteção para Doenças Crônicas por Inquérito Telefônico.
Source: VIGITEL/MS
Diseases, mortality and costs
Among the diseases that cause more deaths in Brazil, the cardiovascular diseases are at first place (more than 29% per year) and cancer is in the second place (more than 15% per year). The data to 2003 indicate the lung cancer it’s the cancer that cause more deaths in men and is the second cause to death in women with cancer disease.
A study conducted by a researcher at the Fiocruz Marcia Pinto based on 2011 monetary values, entitled "The burden of smoking-related diseases in Brazil", estimated the cost attributable to smoking was 21 billion Reais a year to the health system. The study analyzed a total of 2,442,038 diseases and of these, 34% were attributable to smoking (Pinto, 2012).
In 2015, the same researcher published the article " The burden of smoking-related diseases in Brazil: mortality, morbidity and costs" which evaluated the Years of Life Lost (YLL) attributable to smoking at the population level, and estimated two components: Potential Years of Life lost due to premature death (YPLL) and YLL to live with reduced quality of life (YLL-QOL). With the inclusion of these variables the total cost to the health system attributable to smoking spent reached 23.3 billion Reais per year (Pinto et al. 2015).
The data from the 2011 survey were updated and its results showed that in the year 2015, smoking generated health care costs associated with smoking in Brazil by almost 40 billion reais, equivalent to 8.04% of all expenses in Health, and indirect costs reached more than 17 billion reais due to productivity lost due to premature death and disability. Total results point to an annual loss of 56 billion reais, equivalent to 0.96% of national GDP. On the other hand, the total tax revenue from the sale of tobacco and derivatives products reached approximately 13 billion reais in 2015, an amount that covers only 33% of the direct costs caused by smoking to the health system, which represents only 23% Of the total expenditure attributable to smoking (Pinto et al, 2017).
"Deaths from lung cancer and chronic obstructive pulmonary disease (COPD) accounted for 81% and 78%, respectively, while 21% of deaths from heart disease and 18% for stroke were also associated with this risk factor (tobacco). All the tumors revealed that 31% of deaths were due to the consumption of tobacco. Secondhand smoking and perinatal causes totaled 16,920 deaths". In 2011, there were 147.072 deaths from tobacco related diseases (Pinto, 2012).
Tobacco Leaf Production
According to data from the Brazilian Institute of Geography and Statistics (IBGE)1, in the decades from 1990 to 1999 and from 2000 to 2009, tobacco production in Brazil grew by 41% and 49%, respectively.
The comparison between these two periods indicates that the annual average of leaf tobacco production grew by 48%. For the entire series (1990 to 2009), the volume of tobacco production in Brazil grew by 94%.
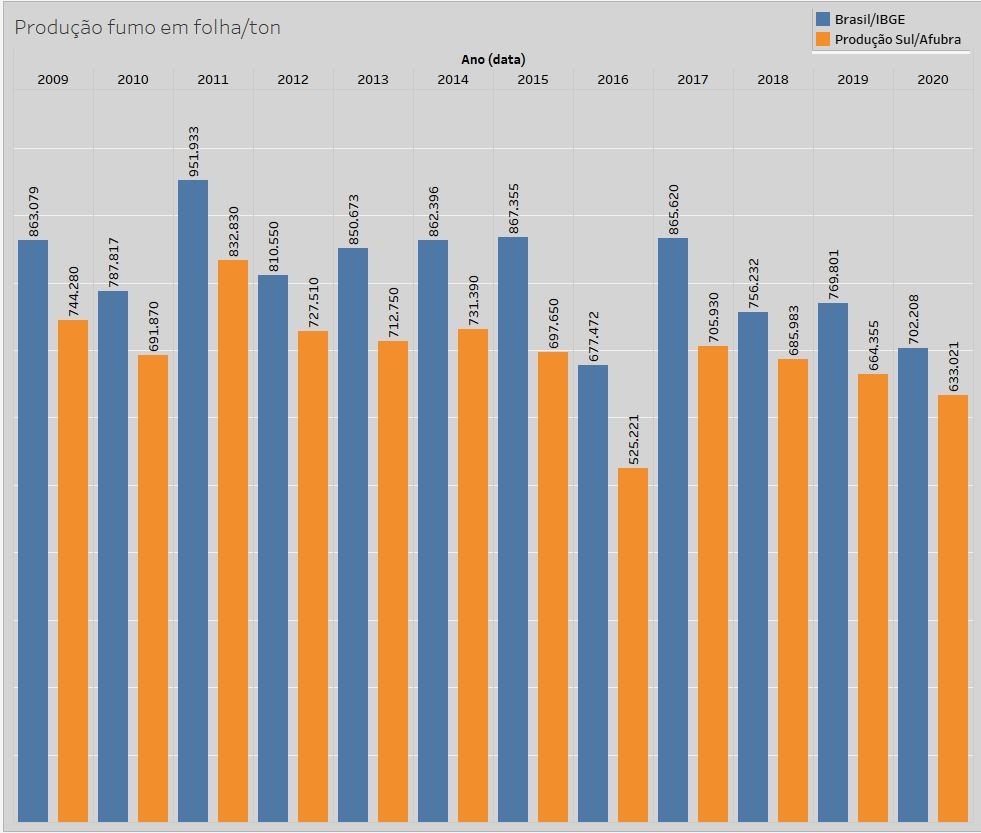
Between 2009 and 2020 production was reduced by 18.64%. IBGE data originate from Municipal Agricultural Production (PAM), where data are collected via Technical Assistance and Rural Extension companies (Ater) and City Halls. The Association of Tobacco Growers of Brazil (AFUBRA)[i] points to a decline of 14.95% (Graph 2) in tobacco production in the southern region of Brazil between 2009 and 2020, and this drop is compared to the 2011, represented 17.63%.
AFUBRA records data only on tobacco growers in Brazil integrated into it, not representing the whole, despite making up the vast majority. It is important to note that Afubra calculates the values of the crops corresponding to the months of July of one year to August of the following year, not representing the calendar year.
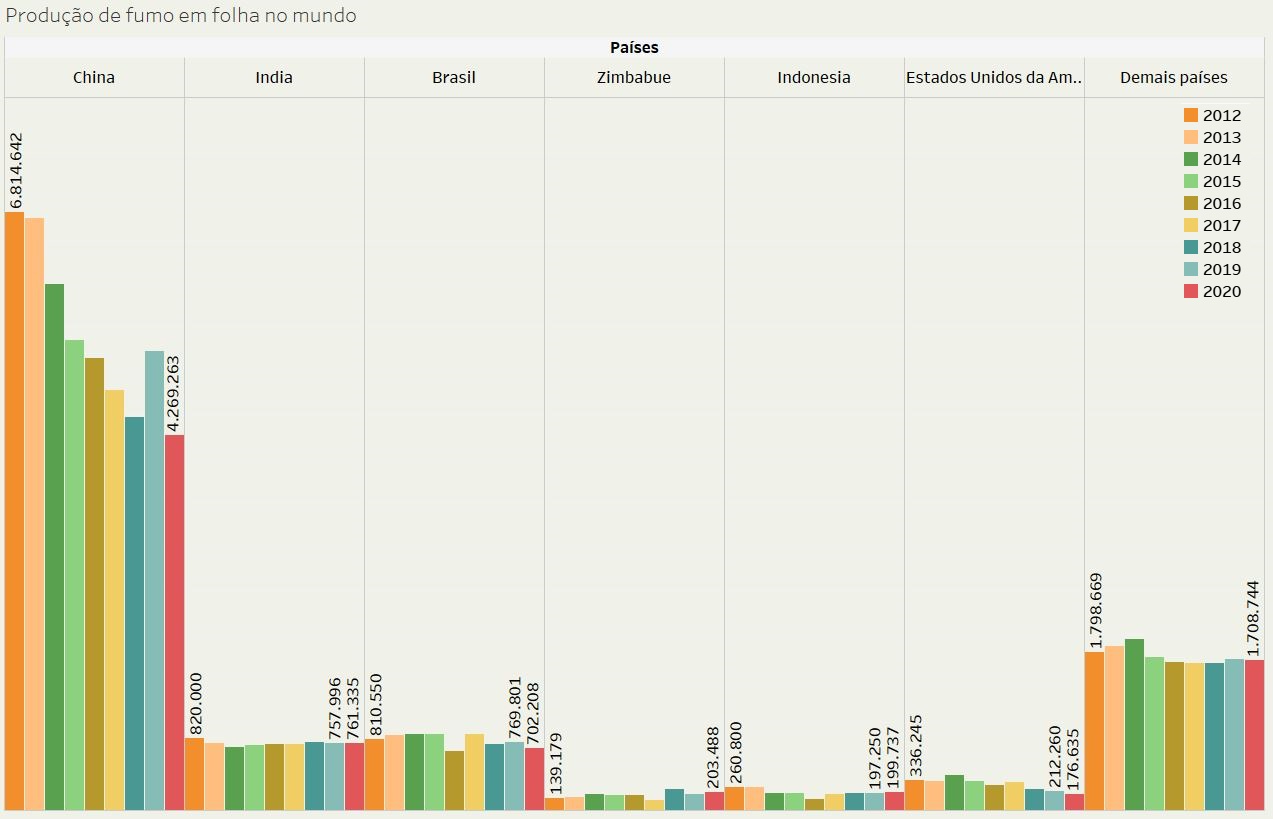
Brazil is the third largest tobacco producer in the world. The first producer is China (Graph 3).
Graph 2 - Tobacco Leaf Production - 2009-2020
Sources: IBGE and Afubra
Graph 3 - Production of leaf tobacco in the world - 2012-2020
Source: FAOSTAT
Tobacco Exportation
Data on national tobacco exports extracted from the ComexStat system (SECINT, 2021) of the Special Secretariat for Foreign Trade and International Affairs of the Ministry of Economy, indicate a growth for the period between 2000 and 2009 in pre- and post- processing (i).
Brazil exported in the first half of the last decade (between 2000 and 2004), on average, 353 thousand tons of pre-processed tobacco per year. As of 2007, the country increased this volume to more than 500 thousand tons, higher than what had been observed.
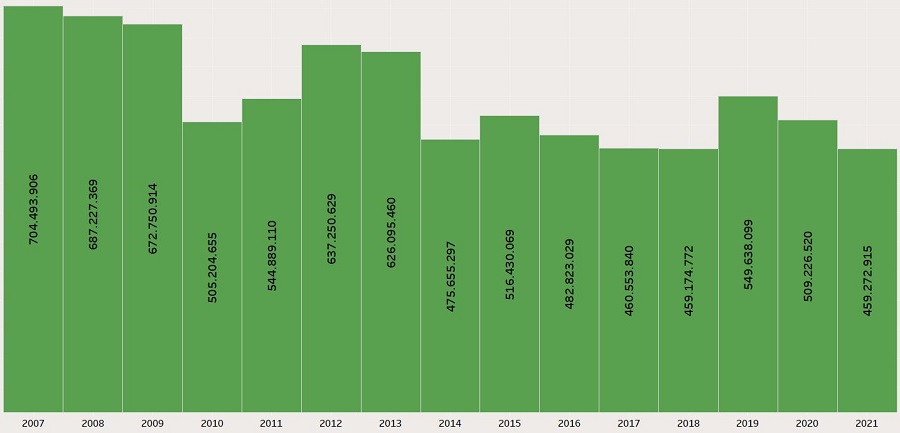
In 2010, there was a drop in the amount of tobacco exported, but the trend of pre- and post-processed tobacco exports grew until 2012. In 2013, there was a slight drop in the volume of exports, which was confirmed in 2014 (-24%), being lower than the volume exported in 2010 (graph 4).
The devaluation of the Brazilian currency allowed a small increase in the volume exported in 2015, however the revenue was lower. Again, between 2016 and 2018, the volume exported showed small reductions.
According to the president of the Interstate Tobacco Industry Union (Sinditabaco), Mr. Iro Schünke, in 2018 China, which has acquired between 40 and 45 thousand tons per year, delayed part of its purchases that year and ended up being shipped only at the beginning of 2019, thus influencing the total volume at the end of the year (Gazeta do Sul , 2020).
In the years 2020 and 2021, exports continue to decline, reflecting both the reduction in tobacco consumption in the world and the insertion of electronic smoking devices (EDS) in the world market, as they use much less tobacco leaves to extract nicotine, or even replace it with synthetic nicotine (ACTbr, 2022).
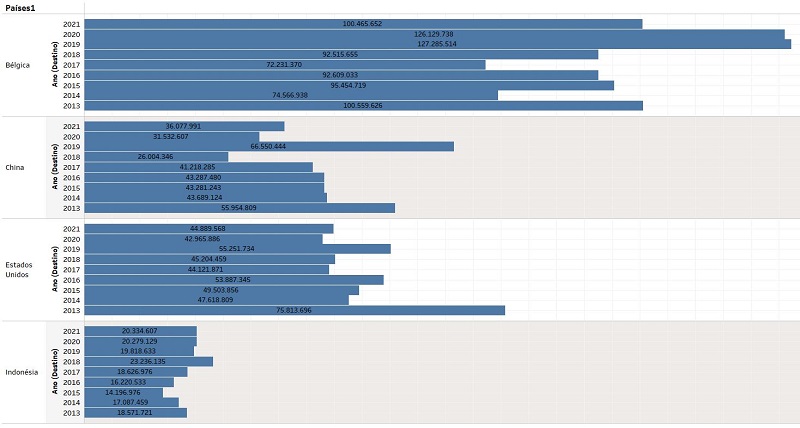
According to 2021 data, extracted from the ComexStat system of the Special Secretariat for Foreign Trade and International Affairs/ME, the top 8 importing countries are: Belgium (22%), United States (10%), China (8%), United Arab Emirates (5%), Indonesia (4%), Russia (4%), Paraguay (4%) and Turkey (3%), represented in Graph 5. Between the years 2013 and 2021, the total exports of leaf tobacco fell by 35%, according to data from the same system. The distribution of Brazilian tobacco around the world is represented on the map, with emphasis on the three largest destinations.
Graph 6 also shows the drop in exports to China in 2018, according to information from the Interstate Tobacco Industry Union (Sindibaco) due to the fact that part of its 2018 purchases were shipped only in early 2019, thus influencing the volume total at the end of the year2, confirmed by the volume presented in 2019. However, in the years 2020 and 2021 the decline persists.
(i) Pre-processing tobacco is the volumes of non-manufactured tobacco products, ie before the processing step is carried out, and is equivalent to the categories 2401.10.10 to 2401.20.90 of the Mercosur Common Nomenclature (NCM). Post-processing smoke refers to those volumes of tobacco products considered after the processing step, equivalent to categories 24.01.30.00 and the entire section 24.03 of the NMC.
Graph 4 - Brazilian leaf tobacco exported between 2007-2021/KG
Source: ComexStat -SECINT/ME
Graph 5 - Destinations Brazilian tobacco leaves - 2021

Source: ComexStat -SECINT/ME
Graph 6 - Main destinations of Brazilian tobacco/KG - 2013-2021
Source: ComexStat -SECINT/ME
Per Capita Consumption
Along with the prevalence of smokers, the apparent per capita consumption of cigarettes represents an important indicator of National Tobacco Control Policies. The method used to calculate the apparent consumption of cigarettes is the one suggested by the World Health Organization. The calculation formula is: Cigarette production – Cigarette export + Cigarette import. The calculation of apparent consumption per capita for individuals over 18 years of age uses the following formula: apparent consumption / population over 18 years of age.
Data on cigarette production and export can be found on the Federal Revenue website and on cigarette imports in the ComexStat system of the Special Secretariat for Foreign Trade and International Affairs of the Ministry of Economy (SECINT, 2021). The population quantity projected for individuals over 18 years old was obtained from the website of the Brazilian Institute of Geography and Statistics/Population Projection (IBGE, 2021).
The apparent official per capita consumption of cigarettes decreased by 65% between 1980 and 2010 (the downward trend began in the late 90's, from which we observe a more intense and continuous decrease in consumption.
In 2016, Brazil recorded lower apparent consumption of cigarettes per capita (Graph 7), however there was a slight increase in subsequent years that may reflect the stagnation of the tax burden on cigarettes.
The consumption decrease directly affected the production of cigarette packs containing 20 units, according to the Federal Revenue Secretariat. Between 2007 and 2016, there was a 53% decrease in cigarette production.
Graph 7 - Per capita consumption x Prevalence
Sources: IBGE, Vigitel, SECINT/ME
References:
ACTbr. 2022. Fatos sobre a nicotina. https://actbr.org.br/uploads/arquivos/ACT-Nicotina-FactSheet---220322.pdf
Gazeta do Sul. 2020. Cenário é de confiança na economia em 2020. http://www.gaz.com.br/conteudos/regional/2020/01/02/159881- cenario_e_de_confianca_na_economia_em_2020.html.php
IBGE. Instituto Brasileiro de Geografia e Estatística-MPOG e Instituto Nacional de Câncer-MS. (2009). Pesquisa Nacional por Amostra de Domicílios-Tabagismo-PETab. Retrieved Jully 15, 2021, from Instituto Brasileiro de Geografia e Estatística:
https://biblioteca.ibge.gov.br/visualizacao/livros/liv42980.pdf
IBGE. Instituto Brasileiro de Geografia e Estatística-MPOG e Fundação Oswaldo Cruz-MS. (2014). Pesquisa Nacional de Saúde 2013-Percepção do estado de saúde, estilos de vida e doenças crônicas. Retrieved July 15, 2021, from Pesquisa Nacional de Saúde:
https://biblioteca.ibge.gov.br/visualizacao/livros/liv94074.pdf
INAN. Instituto Nacional de Alimentação e Nutrição-MS. (1990). Pesquisa Nacional sobre Saúde e Nutrição: perfil da população brasileira de 0 a 25 anos. Retrieved July 15, 2021, from Portal da Saúde:
https://biblioteca.ibge.gov.br/visualizacao/livros/liv81879.pdf
IBGE. Instituto Brasileiro de Geografia e Estatística-MPOG e Secretaria de Vigilância em Saúde-MS. (2009). Pesquisa Nacional da Saúde do Escolar 2009. Retrieved July 15, 2021, from Instituto Brasileiro de Geografia e Estatística:
https://biblioteca.ibge.gov.br/index.php/biblioteca-catalogo?view=detalhes&id=281874
IBGE. Instituto Brasileiro de Geografia e Estatística-MPOG e Secretaria de Vigilância em Saúde-MS. (2012). Pesquisa Nacional de Saúde do Escolar 2012. Retrieved July 15, 2021, from Instituto Brasileiro de Geografia e Estatística-Estimativas de População:
https://biblioteca.ibge.gov.br/index.php/biblioteca-catalogo?view=detalhes&id=264436
Pinto, M.T. A. P.-R. (2012). ACT+. Retrieved July 15, 2021, from: http://www.actbr.org.br/uploads/conteudo/721_Relatorio_Carga_do_tabagismo_Brasil.pdf
Pinto, M., Riviere, A., & Bardach, A. (2015). A Estimativa da Carga do Tabagismo no Brasil: mortalidade, morbidade e custos. Caderno de Saúde Pública 31(6), 1283-1297. Retrieved July 15, 2021, from:
http://www.scielo.br/pdf/csp/v31n6/0102-311X-csp-31-6-1283.pdf
Pinto M, Bardach A, Palacios A, Biz AN, Alcaraz A, Rodríguez B, Augustovski F, Pichon-Riviere A. 2017. Carga de doença atribuível ao uso do tabaco no Brasil e potencial impacto do aumento de preços por meio de impostos. Documento técnico IECS N° 21. Instituto de Efectividad Clínica y Sanitaria, Buenos Aires, Argentina. Maio de 2017. Retrieved July 15, 2021, from: www.iecs.org.ar/tabaco
SECINT. 2021. Ministério da Economia. Exportação e Importação Geral. ComexStat. http://comexstat.mdic.gov.br/pt/home